
Braking RFD Across Two Test Dates: What the Curve Tells You Before Game Day
Two outside hitters. Six weeks apart. One forensic question — are they ready to play?

Braking Rate of Force Development is not a performance metric.
It is a readiness metric.
Most practitioners stop at jump height. Jump height tells you what the output was. Braking RFD tells you how the nervous system prepared to express that output — how rapidly it generated force in the deceleration phase before propulsion begins.
When Braking RFD rises across consecutive testing dates, that is not just a number trending up. It is a signal that the athlete’s neuromuscular system is switching on faster — that the eccentric-to-concentric transition is being executed with greater urgency and precision.
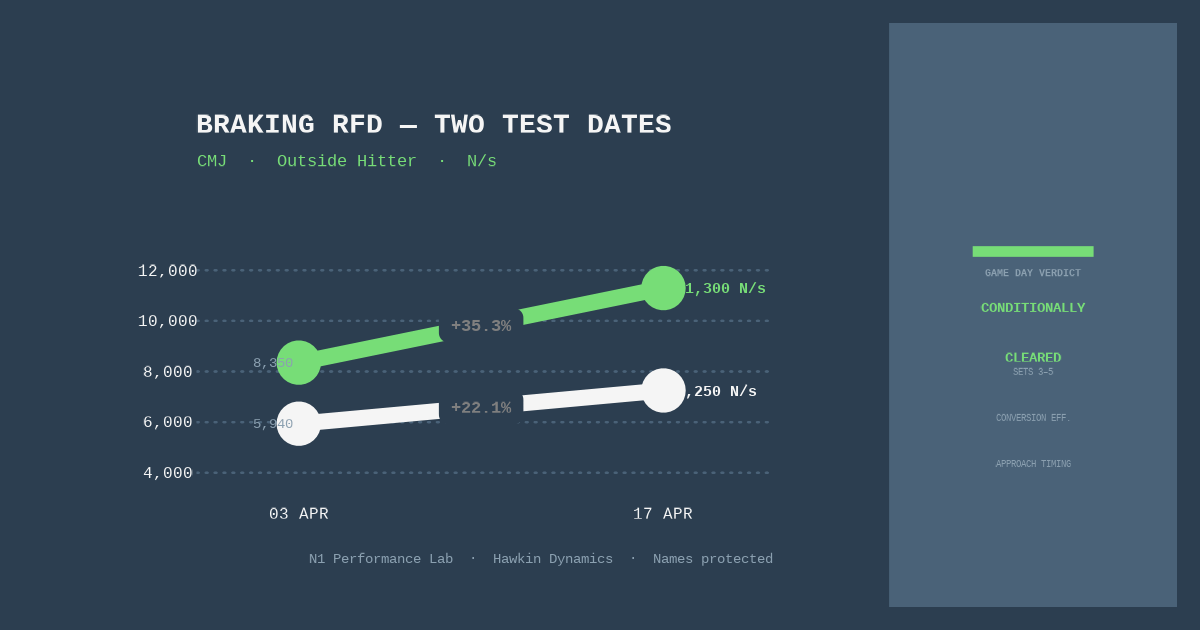
We tested two outside hitters from the same program on 03 April and again on 17 April. Same protocol. Same testing window relative to the training load cycle. Here is what the data said.
OH·A — Outside Hitter
Braking RFD: 5,939 → 7,251 N/s (+22.1%)
RSI: Above baseline · mRSI: Above baseline
Time To Takeoff: Below SWC · Impulse Ratio: Below SWC
OH·B — Outside Hitter
Braking RFD: 8,351 → 11,296 N/s (+35.3%)
RSI: Above baseline · mRSI: Above baseline
Time To Takeoff: Below SWC · Impulse Ratio: Below SWC
Both athletes show the same structural pattern: braking capacity rising sharply while the efficiency of converting that braking impulse into propulsive output has not yet caught up.
In volleyball, this matters directly. An outside hitter who can brake harder and faster will land more safely after a swing, absorb approach contacts more efficiently, and sustain explosive effort across five sets. The rising Braking RFD is a clear green signal on that dimension.
But the Impulse Ratio being below SWC tells us the system has not yet fully integrated that braking capacity into efficient takeoff sequencing. The brake is loaded. The launch is not yet synchronized with it.
The Forensic Read
This pattern has a name. It is mid-adaptation.
The training continuum makes it predictable. Building eccentric force capacity comes first. High-velocity, short-duration expression of that capacity comes second, when the body has accumulated enough cycles at the new force level to integrate it. The braking mechanism upgrades before the propulsive system can synchronize to it. Every time.
In sets one through three: this probably does not register. Both athletes express power cleanly.
In sets four and five, after accumulated neuromuscular cost across a full match week — that efficiency gap is where you lose approach timing. A slightly slower first step off the ground. A fractionally lower contact point on the swing. Not visible to most coaches. Visible in the data.
Game Day Verdict
Both athletes: conditionally cleared. Compete as programmed.
The coaching staff watchpoint: conversion efficiency under repeated-effort conditions in sets three through five.
What Comes Next
The next test date is the inflection point. If Impulse Ratio closes the gap, this adaptation is integrating cleanly. If it does not, you have an early indicator to act on before it becomes visible in performance.
That is the value of two-date tracking. Not the snapshot. The trajectory.
Braking RFD is not a performance number. Read it that way.
Data: Hawkin Dynamics CMJ. Metrics averaged across three trials per session. Athlete identities and institutional affiliations protected. SWC = Smallest Worthwhile Change.
The interactive magazine edition of this article is live — 10 pages, fully annotated, horizontal swipe format. If you want the full forensic version, the link is below.