
The Phase Map: Reading Movement Intelligence from a Single CMJ
Six phases. 47+ metrics. Jump height is one of them — and it moves last.

A01 through A04 built the foundation: positional differences, Braking RFD as a readiness signal, soft tissue loading patterns, and injury risk flags. A05 asks the question those articles kept implying — if jump height is the last metric to move, what moves first? The phase map is the answer. This is the article that puts all six phases in sequence and shows what each one is actually measuring.
Jump height is one number. A single countermovement jump produces 47 metrics.
The coach sees the number. The phase map sees the movement.
Article 04 in this series identified two failure modes — conversion failure and compensatory loading — in asymptomatic Middle Blockers on a routine test day. Both were flagged by the braking phase, not by jump height. Article 05 asks where in the 6-phase jump those failures originate, and what phase-level monitoring catches that jump height alone will always miss.
What the phase map is
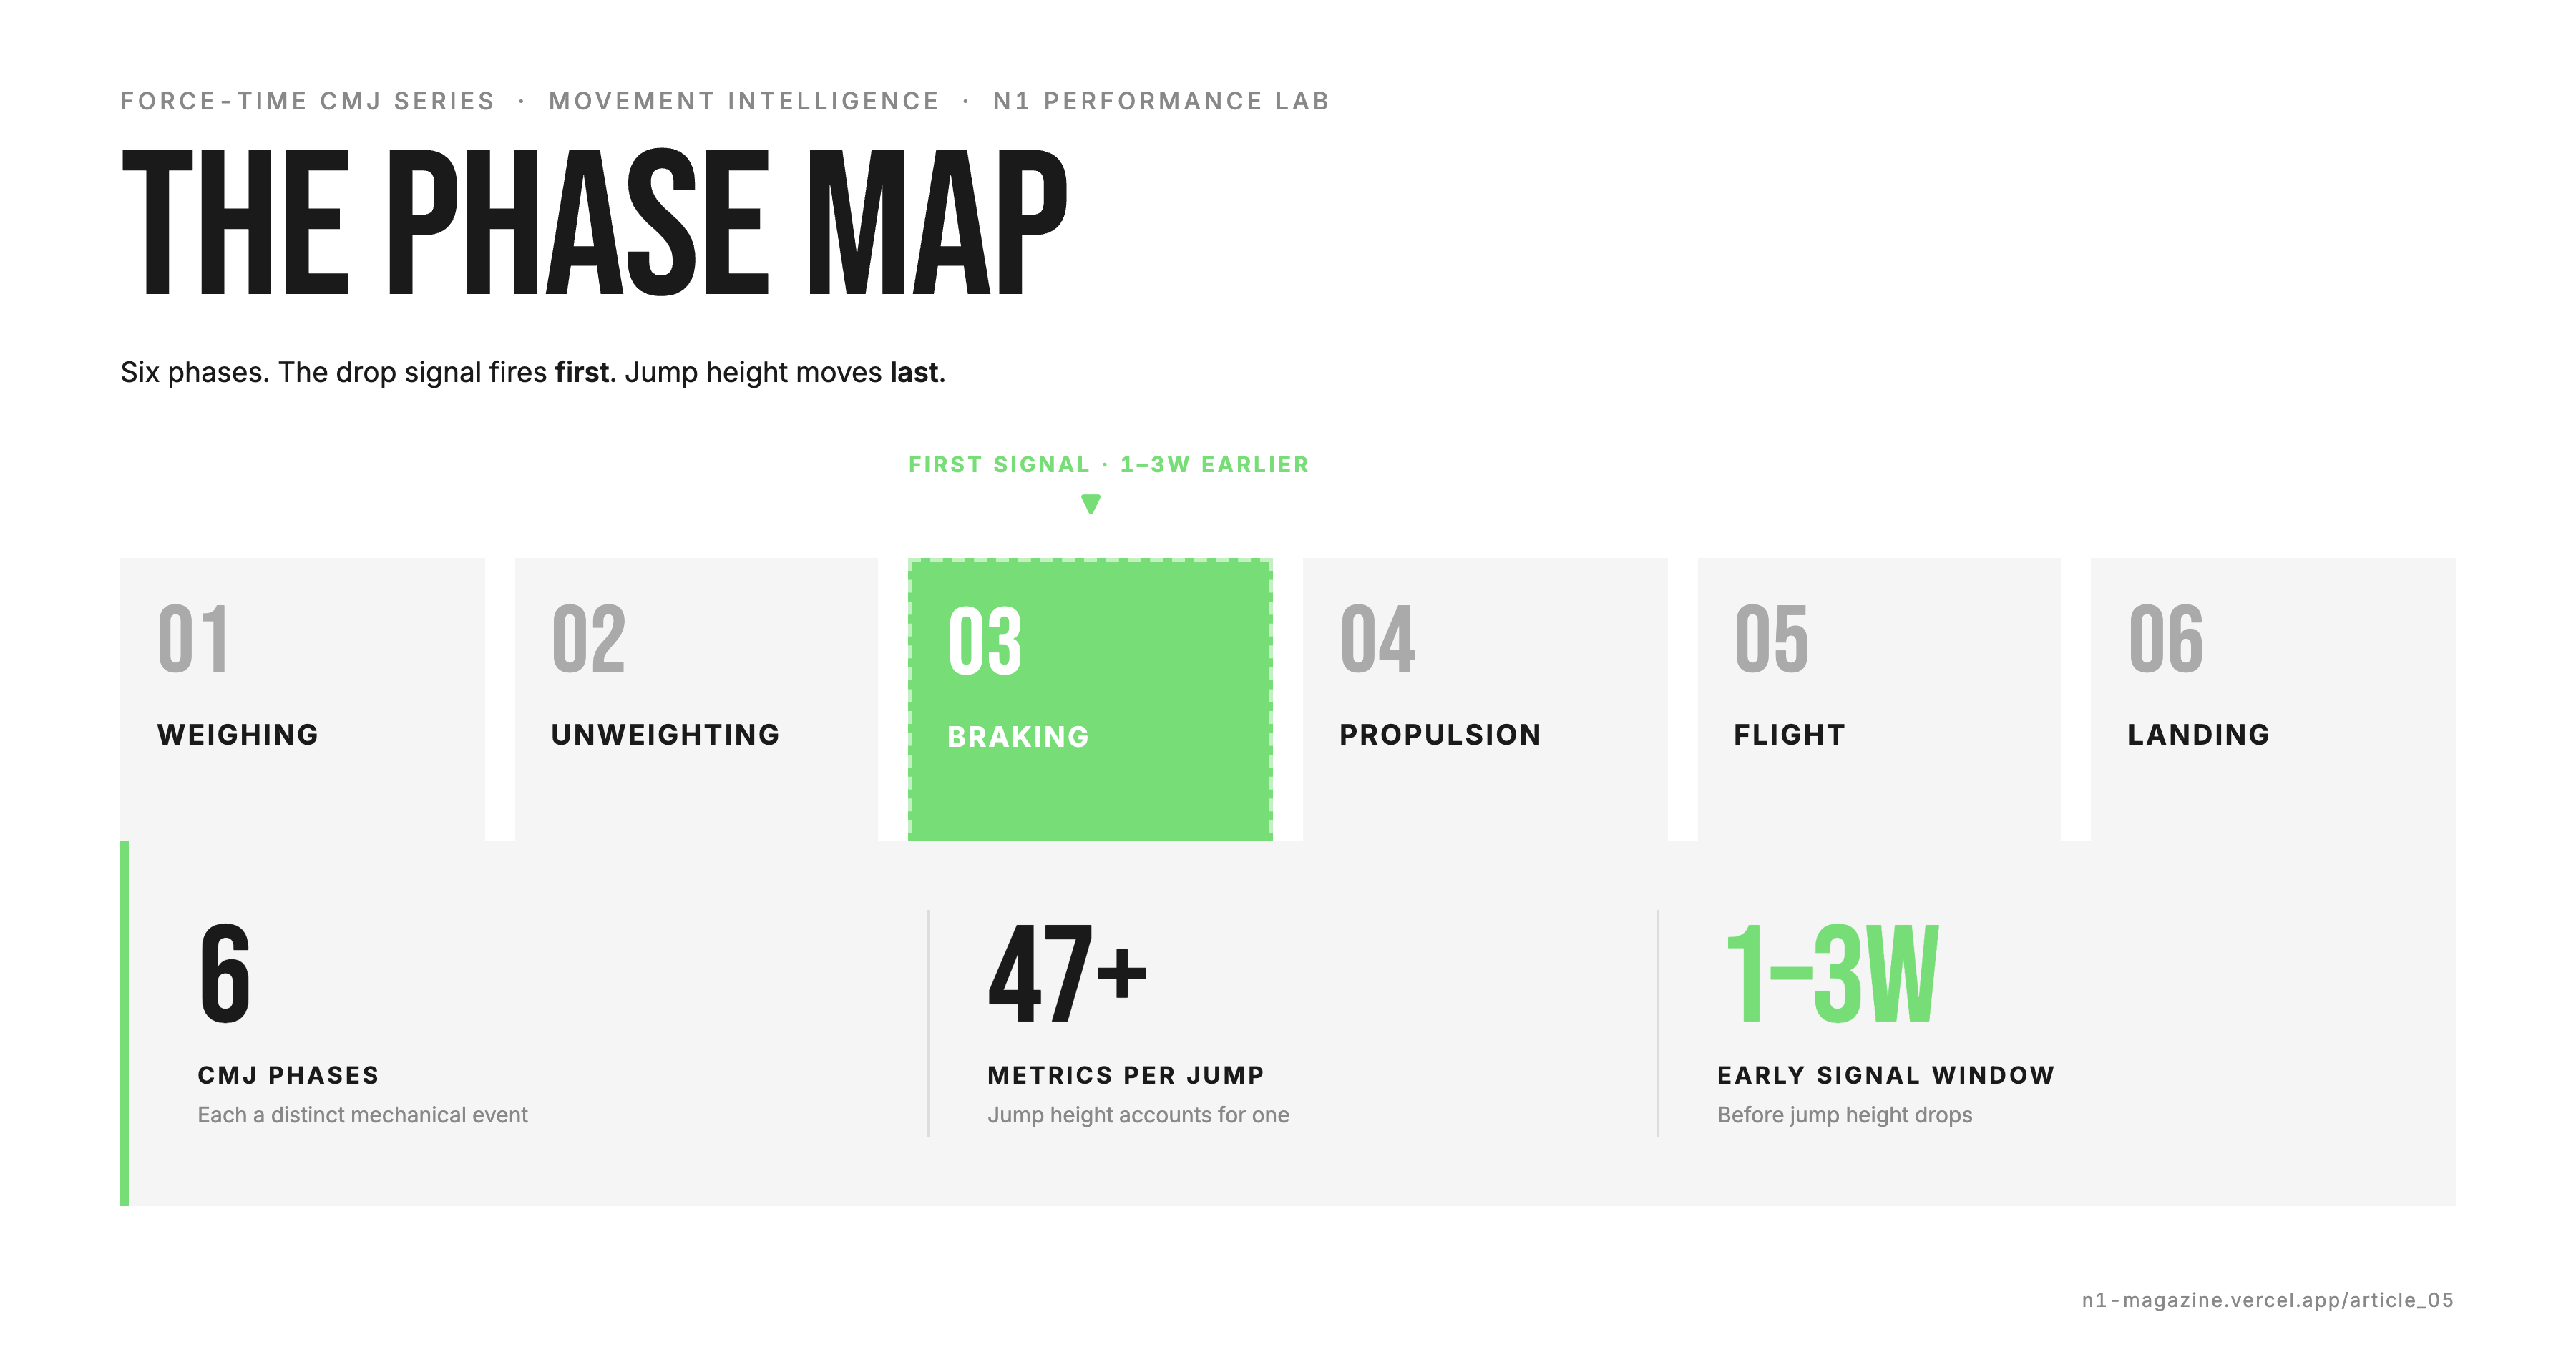
Every CMJ passes through six distinct mechanical events: Weighing, Unweighting, Braking, Propulsion, Flight, Landing. Each phase produces a distinct set of metrics. Each phase carries a distinct readiness and injury signal.
Jump height sits in Phase 5. It is the last variable to shift under fatigue. By the time it drops, every earlier signal has been firing for 1–3 weeks.
Phase-level monitoring is not more data. It is earlier data.
The braking phase is the primary signal
Phase 3 — Braking — is where the body arrests downward momentum and reverses direction. Force rises rapidly. The speed of that rise — Braking RFD — is the first metric to move when neuromuscular fatigue accumulates.
Braking RFD drops before jump height drops. It drops before RPE rises. In [ORGANIZATION] Women’s Volleyball monitoring, the pattern has been consistent: the athlete feels fine. The curve has already moved.
Two athletes. Same jump height. Different movement profiles.
Article 05 compares MB·1 and MB·2 — two Middle Blockers from the same squad, tested in the same block.
MB·1 loads the braking phase correctly. The eccentric demand is met. Force development rate is adequate. But at the braking-to-propulsion transition, the energy transfer breaks down. Propulsive impulse is lower than the braking input predicts. The jump underperforms its own mechanical setup.
MB·2 presents the inverse problem. The braking phase is asymmetric. The dominant limb is absorbing load the non-dominant limb is no longer contributing equally. Jump height is maintained — the compensation is working. The tissue loading is not sustainable.
Two athletes. Nearly identical jump heights. Opposite problems. Invisible without phase-level data.
The fatigue sequence is predictable
When monitoring identifies a Braking RFD decline across consecutive sessions — 7,400 → 6,800 → 6,200 N/s — what follows is consistent.
Weeks 1–2: Braking RFD declines. Neuromuscular fatigue is accumulating in the eccentric phase. Jump height has not moved. The athlete reports no change in readiness.
Weeks 2–3: The braking deficit propagates forward. The Phase 3-to-Phase 4 transition leaks more elastic energy. Propulsive impulse begins to fall. Jump height starts to show minor variance — still within noise for most systems.
Week 3+: Jump height drops. By this point, the injury window has been open for 1–3 weeks.
Monitoring only jump height means monitoring the end of the sequence.
What this means for monitoring infrastructure
A single CMJ session produces a snapshot. Braking RFD is 6,200 N/s. Compared to what? Without a personal baseline and a trend direction, a single number is close to meaningless for readiness decisions.
Weekly monitoring produces a trend. The trend is the signal. The athlete’s personal baseline makes the decline readable. The trend makes it actionable. This is where athlete monitoring in Manila — consistent, session-over-session — changes what the data can do.
This is the case for local sports science infrastructure. Not the hardware. The continuity.
The practical verdict
Read the phase map, not just the flight phase.
MB·1’s next session targets the Phase 3-to-Phase 4 transition. The braking is loading — the conversion is not. MB·2’s bilateral asymmetry has crossed the 10% threshold. The loading pattern needs intervention before the compensation fails.
N1 Performance Lab PH tests the full squad in one session. Two hours. Six-phase profiles per athlete — braking, propulsive, and landing. One training priority per position. The session that makes every future test readable.
To book a testing session or start ongoing monitoring: n1labph@gmail.com | @n1labph on Instagram.
Article 06 continues the series. The force-velocity profile — where each athlete sits on the spectrum from force-dominant to velocity-dominant — is the next diagnostic layer.
Read the full issue: n1-magazine.vercel.app/Article_05?utm_source=substack&utm_medium=email&utm_campaign=A05